Trucking Cost Per Mile Calculator for Excel
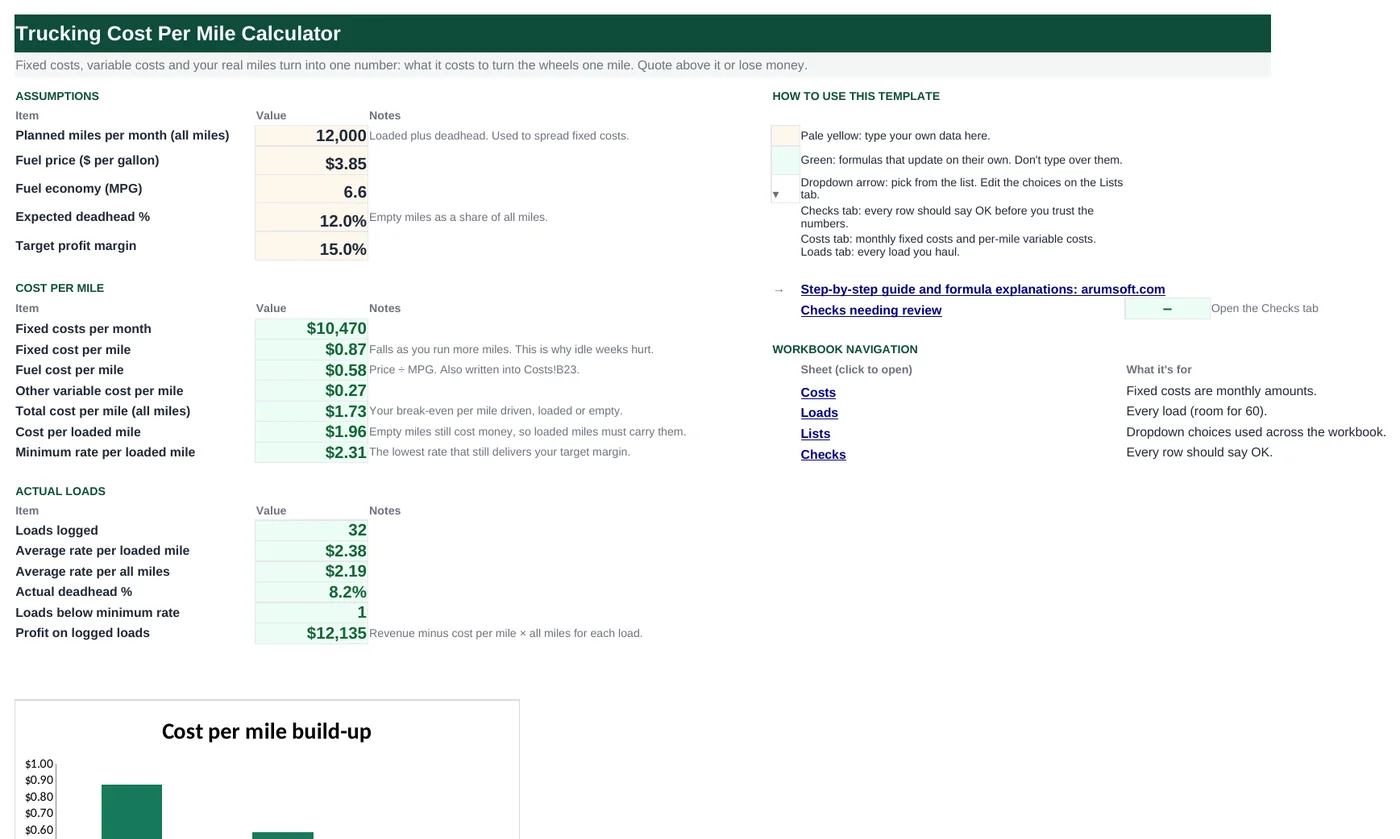
Every load you accept is a bet that the rate beats your cost per mile. This workbook builds that number from your truck payment, insurance, fuel economy and maintenance, converts it to a cost per loaded mile that carries your empty miles, and adds the margin you want to give a minimum rate. The Loads tab then scores every load you haul against it and totals profit by month.
- Sheets:
- 5
- Works with:
- Excel for Microsoft 365, Excel 2016 or later, Excel for Mac and Excel for the web
- Updated:
What you can do with it
- Fixed cost per mile from monthly costs and planned miles
- Fuel cost per mile from price and MPG, plus tires, maintenance and tolls
- Cost per loaded mile and the minimum rate that delivers your target margin
- A load log with rate per mile, profit and Good / Thin margin / Below minimum status
What's inside
The workbook has 5 sheets. You only type on a few of them; the rest calculate.
| Sheet | What it's for | You enter | Calculated for you |
|---|---|---|---|
| Start Here | Assumptions and the cost per mile build-up | Planned miles, fuel price, MPG, deadhead %, target margin | Fixed per month and per mile, fuel per mile, other variable, total cost per mile, cost per loaded mile, minimum rate, actual load summary |
| Costs | Fixed and variable cost inputs | Monthly fixed costs (15 rows); per-mile variable costs (9 rows) | Fuel per mile from Start Here; totals |
| Loads | One row per load (room for 60) | Date, load #, origin, destination, loaded and deadhead miles, rate, source | All miles, rate per loaded mile, cost of load, profit, status, monthly summary |
| Lists | Dropdowns | Load sources | Nothing |
| Checks | Six data checks | Nothing | OK or Review |
Before you start
- List your monthly fixed costs: truck and trailer payments, insurance, permits, ELD, your own pay or draw, parking.
- Estimate per-mile costs for tires and maintenance over the life of the equipment, and your average tolls.
- Know your realistic monthly miles (loaded plus empty) and your fuel economy from the last few fills.
Step-by-step guide
Enter the assumptions
Start Here B6 planned miles per month, B7 fuel price, B8 MPG, B9 expected deadhead %, B10 the margin you want.
Fill in the Costs tab
Fixed costs per month in rows 5–19; variable costs per mile in rows 24–32. Fuel (row 23) is calculated from Start Here.
Read the cost per mile
Start Here B18 is the all-miles cost per mile; B19 is the cost per loaded mile after deadhead; B20 is the minimum rate per loaded mile that still leaves your margin.
Log loads
Loads tab: date, load number, origin, destination, loaded miles, deadhead miles, rate (linehaul plus fuel surcharge), source. Rate per loaded mile, cost, profit and status calculate.
Watch the actuals
Start Here rows 24–29: average rate per loaded mile and per all miles, actual deadhead %, loads below minimum, and profit. The monthly summary on the Loads tab (columns O–S) breaks it down by month.
Check the Checks tab
Missing assumptions, loads without miles or a rate, duplicate load numbers, actual miles far from the planned figure, and deadhead over 20%.
Formula map
Every formula in the workbook, grouped by the sheet and column it lives in. A column of copied formulas counts once; the range it covers is shown.
| Sheet | Cells | Functions | What it computes | Reads | Feeds |
|---|---|---|---|---|---|
| Start Here | B15 | IF | Fixed cost per mile | B14, B6 | Part of the total cost per mile in B18. |
| Start Here | B16 | IF | Fuel cost per mile | B7, B8 | Also written into Costs B23 so the variable list is complete. |
| Start Here | B19 copied down to row 20 | IF | Cost per loaded mile | B18, B9 | The base for the minimum rate. |
| Start Here | B20 copied down to row 20 | IF | Minimum rate per loaded mile | B19, B10 | Loads below this are flagged on the Loads tab. |
| Costs | A23 | TEXT | Fuel label | — | Cosmetic, but it stops the fuel line from being edited by hand. |
| Loads | I5 copied down to row 64 | IF, OR | Rate per loaded mile | G5, E5 | Drives the status in column L. |
| Loads | J5 copied down to row 64 | IF | Cost of the load | H5 | Profit is the rate minus this. |
| Loads | L5 copied down to row 64 | IF | Status | I5, K5 | Conditional formatting colors the three states. |
| Loads | S5 copied down to row 6 | SUMIFS, EDATE | Profit by month | O5 | Columns P–R do the same for loads, miles and revenue. |
| Checks | B9 | IF, OR, SUM, ABS, COUNTIF | Actual miles are within 25% of planned | — | The most common reason a cost per mile is wrong is optimistic planned miles. |
Every formula, explained
Each formula below is copied straight from the file, so what you read here is exactly what the cell contains. Click any cell in Excel to see it in the formula bar.
=IF(B6=0, 0, B14/B6)Monthly fixed costs spread over the miles you expect to run. More miles, lower cost per mile.
Piece by piece
B6=0- No planned miles: show 0 rather than an error.
B14/B6- Fixed per month ÷ miles per month.
With the sample data: B14 = 10,470, B6 = 12,000 → B15 result 87.2%
How it is used: Part of the total cost per mile in B18.
How to change it: Nothing to change.
Learn this: How to Write Basic Formulas in Excel →=IF(B8=0, 0, B7/B8)Fuel price divided by miles per gallon.
Piece by piece
B8=0- No MPG: show 0.
B7/B8- Dollars per gallon ÷ miles per gallon = dollars per mile.
With the sample data: B7 = 3.85, B8 = 6.6 → B16 result 58.3%
How it is used: Also written into Costs B23 so the variable list is complete.
How to change it: Nothing to change.
Learn this: How to Write Basic Formulas in Excel →=IF(B9>=1, 0, B18/(1-B9))Empty miles cost money but earn nothing, so the loaded miles must carry them. Dividing by (1 − deadhead %) does that.
Piece by piece
B9>=1- A deadhead of 100% or more makes no sense: show 0.
B18/(1-B9)- All-miles cost ÷ the loaded share of miles.
With the sample data: B18 = 1.73, B9 = 12.0% → B19 result 1.96
How it is used: The base for the minimum rate.
How to change it: Nothing to change.
Learn this: How to Write Basic Formulas in Excel →=IF(B10>=1, 0, B19/(1-B10))Cost per loaded mile marked up so that the margin is the target share of the rate (cost ÷ (1 − margin)), not just cost × (1 + margin).
Piece by piece
B10>=1- A margin of 100% or more: show 0.
B19/(1-B10)- Cost per loaded mile ÷ (1 − target margin).
With the sample data: B19 = 1.96, B10 = 15.0% → B20 result 2.31
How it is used: Loads below this are flagged on the Loads tab.
How to change it: Nothing to change.
Learn this: How to Write Basic Formulas in Excel →="Fuel ("&TEXT('Start Here'!$B$7,
"$0.00")&"/gal ÷ "&TEXT('Start Here'!$B$8,
"0.0")&" MPG)"Builds the row label from the fuel price and MPG so the Costs tab shows where the number came from.
Piece by piece
TEXT('Start Here'!$B$7, "$0.00")- Price formatted as currency.
TEXT('Start Here'!$B$8, "0.0")- MPG with one decimal.
"Fuel ("&…&"/gal ÷ "&…&" MPG)"- Joined into the label.
With the sample data: A23 result Fuel ($3.85/gal ÷ 6.6 MPG)
How it is used: Cosmetic, but it stops the fuel line from being edited by hand.
How to change it: Nothing to change.
Learn this: Text and Date Functions in Excel →=IF(OR(B5="", E5=0), "", G5/E5)What the load pays per loaded mile: the number brokers quote and the one to compare with the minimum rate.
Piece by piece
OR(B5="", E5=0)- No load or no miles: show nothing.
G5/E5- Rate ÷ loaded miles.
With the sample data: G5 = 2,400, E5 = 925 → I5 result 2.59
How it is used: Drives the status in column L.
How to change it: Nothing to change.
Learn this: How to Use the IF Function in Excel →=IF(B5="", "", H5*'Start Here'!$B$18)All miles (loaded plus deadhead) times the all-miles cost per mile from Start Here.
Piece by piece
H5- Loaded + deadhead miles.
'Start Here'!$B$18- Total cost per mile (absolute reference so it does not shift when copied down).
With the sample data: H5 = 1,045 → J5 result 1,803.5
How it is used: Profit is the rate minus this.
How to change it: Nothing to change.
Learn this: Relative, Absolute and Mixed References in Excel →=IF(I5="", "", IF(I5>='Start Here'!$B$20,
"Good", IF(K5>=0, "Thin margin", "Below minimum")))Good when the rate per loaded mile meets the minimum; Thin margin when the load is still profitable but under target; Below minimum when it loses money.
Piece by piece
I5>='Start Here'!$B$20- Meets the minimum rate.
K5>=0- Profit not negative.
With the sample data: I5 = 2.59, K5 = 596.5 → L5 result Good
How it is used: Conditional formatting colors the three states.
How to change it: Nothing to change.
Learn this: How to Use the IF Function in Excel →=SUMIFS($K$5:$K$64, $A$5:$A$64,
">="&O5, $A$5:$A$64, "<"&EDATE(O5,
1))Adds load profit for loads picked up in the month in column O. EDATE gives the first of the next month for the upper bound.
Piece by piece
$K$5:$K$64- Load profit.
$A$5:$A$64, ">="&O5- Pickup on or after the month start.
$A$5:$A$64, "<"&EDATE(O5, 1)- Before the next month starts.
With the sample data: O5 = Sep 1, 2026 → S5 result 6,785.33
How it is used: Columns P–R do the same for loads, miles and revenue.
How to change it: Add rows for more months and copy the formulas down.
Learn this: How to Use SUMIF and SUMIFS in Excel →=IF(OR(SUM(Loads!$H$5:$H$64)=0,
ABS(SUM(Loads!$H$5:$H$64)/COUNTIF(Loads!$P$5:$P$6, ">0")/'Start Here'!$B$6-1)<=0.25),
"OK", "Review")Compares average monthly miles from the load log with the planned miles used to spread fixed costs. If they differ a lot, the fixed cost per mile is wrong.
Piece by piece
SUM(Loads!$H$5:$H$64)- All miles logged.
/COUNTIF(Loads!$P$5:$P$6, ">0")- Divided by the number of months with loads.
/'Start Here'!$B$6-1- Ratio to planned, minus 1 = the percentage gap.
ABS(…)<=0.25- Within 25% either way.
With the sample data: B9 result OK
How it is used: The most common reason a cost per mile is wrong is optimistic planned miles.
How to change it: Change 0.25 to tighten the test.
Learn this: How to Use AND and OR in Excel →Tips and limits
- Capacity: 60 loads, 15 fixed cost rows, 9 variable rows, a two-month summary. For a full year, add rows O7:O16 on the Loads tab and copy the summary formulas down.
- Your own pay belongs in fixed costs. A cost per mile that leaves you unpaid is not a cost per mile.
- Update the fuel price weekly; it is the biggest variable and the one the fuel surcharge is supposed to track.
- Deadhead is the silent killer: the sample runs 8% and that alone adds 14 cents to every loaded mile. The expected deadhead on Start Here should match what the log actually shows.
- The minimum rate is for accepting loads, not for quoting. Quote what the lane bears; use the minimum to know when to say no.
Learn the skills behind this template
Was this guide helpful? Spot a mistake? Send feedback · admin@arumsoft.com