What you can do with it
- Layout is computed from the reporting lines: no dragging boxes into place
- Teams of individual contributors stack vertically under their manager when the chart gets wide
- Large charts: an overview of the top two levels, then a slide for each department
- Boxes, connectors and text are ordinary shapes in theme colors, so you can restyle or rearrange them
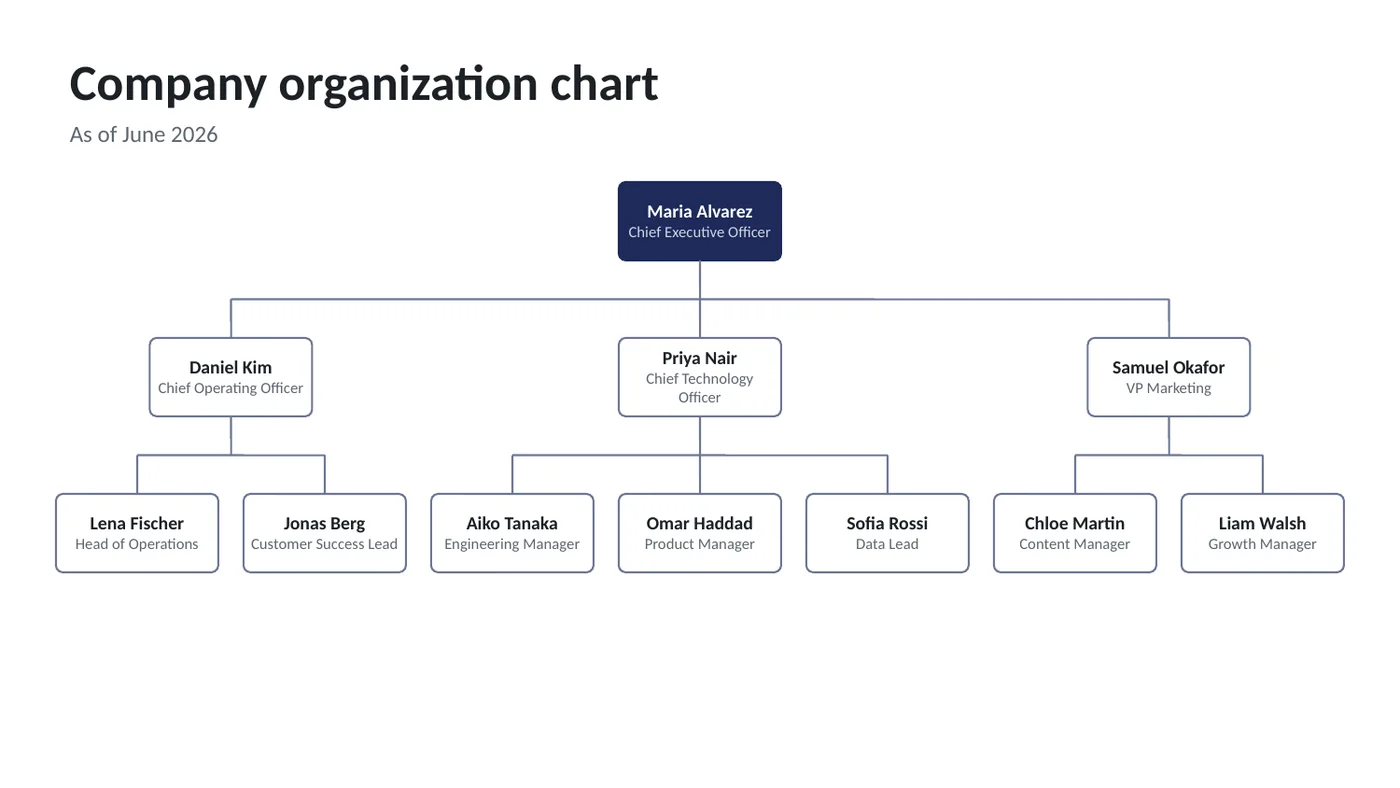
Using the online tool
List your people
One per line:
name | title | manager. The manager is the name of another person on the list, spelled the same way. Leave it blank for the person at the top. Paste from a spreadsheet or an HR export.Check the warnings
If a manager's name doesn't match anyone, that person is placed at the top level and listed under the box. Fix the spelling and the chart redraws.
Let it lay out, or split it
Up to about 20 people fit on one slide. Beyond that, "Split by department when crowded" gives an overview slide and one slide per top-level manager. You can force one slide or always split.
Download and edit
Open the .pptx: retype any name or title, move a box (the connector lines are separate shapes, so nudge those too), or add a photo over a box. Design › Variants changes the colors.
What's in the template
Prefer to start from a file? The template is the tool's output for the sample data, with speaker notes that explain how to edit it. Replace the sample text and you're done.
Editing the slide in PowerPoint
Add a person
Copy an existing box and its connector line, paste, move and retype. For more than one or two changes it's quicker to edit the list here and download again.
Change the top box
The person with no manager gets a filled accent box. To make someone else stand out, select their box and use Shape Fill with a theme color.
Add photos
Insert the picture, crop it to a circle (Crop › Crop to Shape › Oval) and place it on the box. Then widen the box if needed.
Change colors
Connectors and box outlines use a lighter tint of the accent; the top box uses the accent itself. Design › Variants › Colors changes all of them together.
How the slide is built
The layout is a classic tidy tree: each person's box is centered over their reports, leaf boxes get equal spacing, and when the chart would be too wide the teams of individual contributors switch to a vertical stack with a left-side connector, which is how most hand-drawn org charts handle large teams. Boxes are rounded rectangles, connectors are straight line shapes in elbow arrangement, and names and titles are two runs in one text box.
Frequently asked questions
How many people fit on one slide?
About 20 to 25 with readable text, depending on how the reporting lines spread out. The tool stacks wide teams first, shrinks boxes a little, and above roughly 22 people splits into an overview plus department slides.
Someone reports to two managers. What do I do?
List them under their primary manager. Add the dotted line in PowerPoint afterwards: Insert › Shapes › Elbow Connector, then set the line to dashed.
Can I show assistants or a flat team with no manager?
A flat team: give every person the same manager, or leave the manager blank for all of them to show them side by side at the top. Assistants: list them as a report of the executive; they will sit with the other reports.
Is the chart SmartArt?
No. SmartArt org charts are hard to control once they get large. These are plain shapes, so what you see is what you get, and you can move anything.
Is my list uploaded?
No. The chart is built in your browser; names never leave your device. Your last list is saved in this browser only.
Learn the skills behind this template
Was this guide helpful? Spot a mistake? Send feedback · admin@arumsoft.com