What you can do with it
- Calendar header that picks days, weeks, months or quarters to fit your dates (or choose one)
- Progress shown inside each bar; a task with the same start and end becomes a milestone diamond
- Group rows: a line with just a name becomes a bold section header
- Up to 12 rows per slide, continued on the next slide; an optional dashed "today" line
Using the online tool
List your tasks
One per line:
task | start | end | % done. The percentage is optional. Paste four columns from Excel or a project tool. To add a section, put its name on a line of its own above its tasks.Set the time scale
Auto picks days for plans under three weeks, weeks under four months, months under two years, and quarters beyond. Override it when you want, for example weeks for a one-month sprint.
Mark today
Type a date in the "today" box and a dashed line is drawn across the chart with the date under it. Clear the box to remove it.
Download and adjust
Open the .pptx: drag a bar's edge to change a date, retype a label, delete a row, or recolor everything with Design › Variants. The light part of a bar is the remaining work; the dark part is progress.
What's in the template
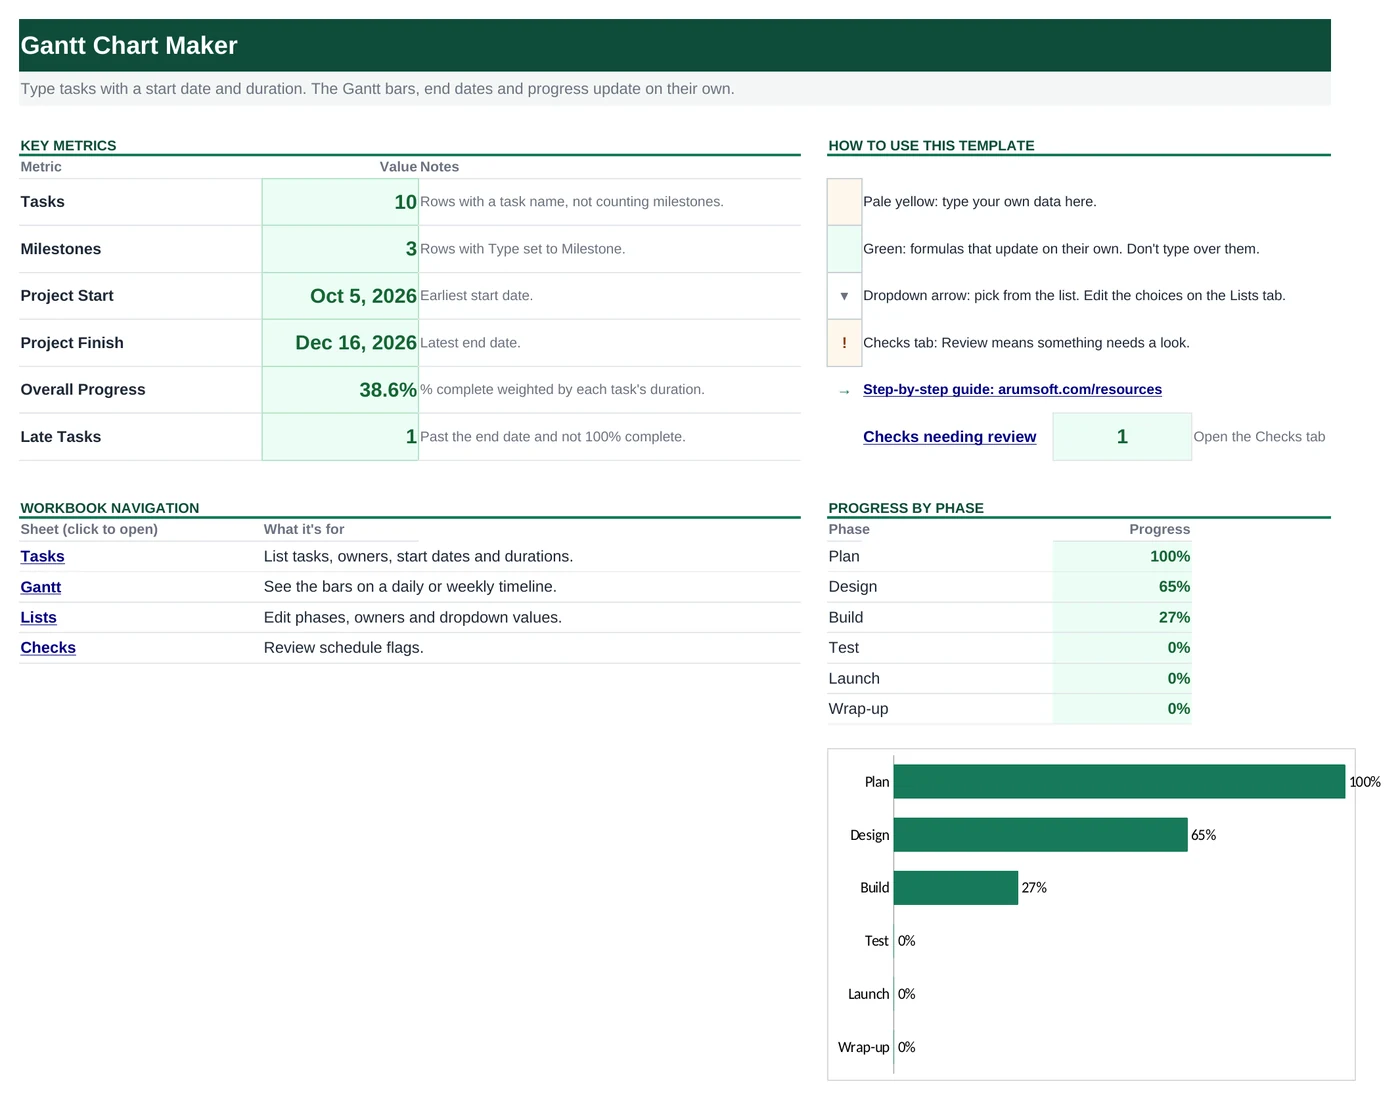
Prefer to start from a file? The template is the tool's output for the sample data, with speaker notes that explain how to edit it. Replace the sample text and you're done.
Editing the slide in PowerPoint
Change a date
Drag the left or right edge of a bar. The columns behind it mark the units, so align the edge with a gridline for a clean start or end.
Add a task
Select a row's label, bar and progress bar, copy and paste, then move the copy down with the arrow keys and retype. Or add the line here and download again.
Change colors
Progress uses the theme accent, remaining work a lighter tint and milestones a darker shade, so Design › Variants › Colors restyles the whole chart in one click.
Make it a weekly chart
Choose Weeks in the time scale before you download. Column labels show the Monday of each week.
How the slide is built
The chart is a grid of plain shapes: a light rectangle for the header band, thin lines for the unit columns, alternating row tints for readability, a rounded rectangle per task and a second one on top for progress. Milestones are diamond shapes. The label column is a text box per row. Positions come from the dates, so a bar's left edge is exactly its start date on the header scale.
Frequently asked questions
How many tasks fit on a slide?
Twelve rows, including section headers. Longer plans continue on a second slide with the same header, marked "(continued)".
Can I show dependencies or arrows between tasks?
Not from the tool. Draw them in PowerPoint with Insert › Shapes › Elbow Connector: connectors snap to the bars and stay attached when you move them.
Why did the scale switch to months?
The scale is chosen from the total span. If a plan runs more than four months, weeks would be too narrow to label, so it moves to months. You can force Weeks in the time-scale box; labels are shortened automatically.
Can I color-code tasks by group?
The download uses one accent color. In PowerPoint, select the bars of a group and give them another theme color from the Shape Fill menu; the progress bars on top keep their darker shade.
Can I update the chart later?
Yes. Your last entries are kept in this browser, so change a date or a percentage, download again and replace the slide.
Learn the skills behind this template
Was this guide helpful? Spot a mistake? Send feedback · admin@arumsoft.com