What you can do with it
- Sort the top 200 US colleges into Reach, Target and Likely from your own numbers
- See an estimated net price for your family's income bracket, with out-of-state tuition added where it applies
- Filter by public or private, size, kind of school, preferred states, budget and graduation rate
- Open any school for admissions, cost, outcomes, student body and 2010–2024 trends, with a link to its Common Data Set
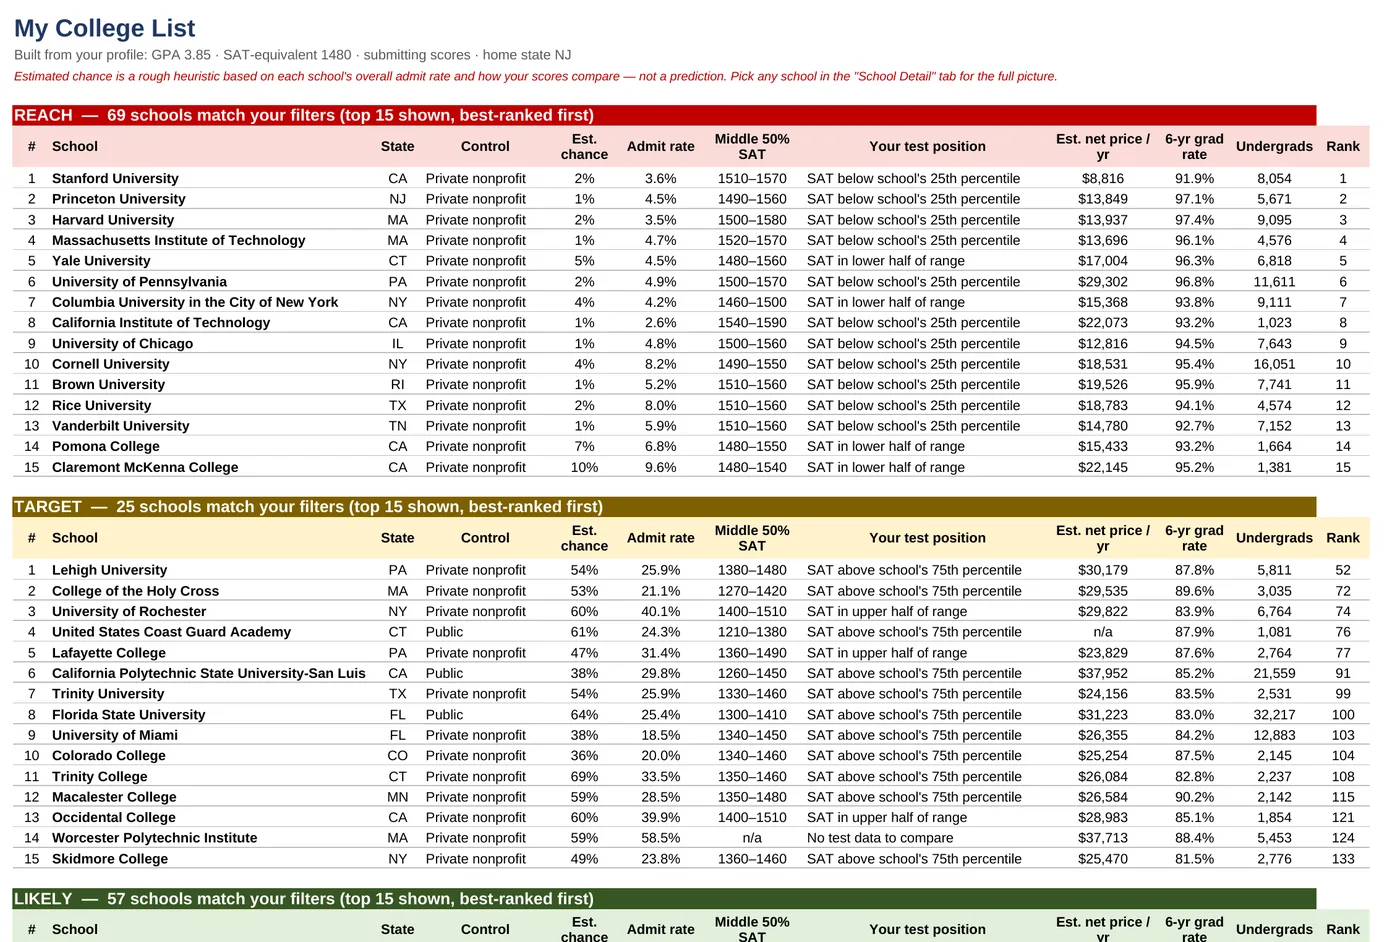
How the estimated chance works
Every school starts from its overall admit rate. That rate is then multiplied by three factors that describe how your numbers compare with the students the school actually admits, and the result is capped between 1% and 95%:
Estimated chance = admit rate × test multiplier × GPA multiplier × in-state multiplier
- Test multiplier. Your SAT (or your ACT converted to an SAT score with the official concordance) is placed on the school's middle-50% range: 0 means you're at the 25th percentile, 1 means you're at the 75th. Being above the 75th percentile raises the odds; being below the 25th cuts them sharply.
- GPA multiplier. Your unweighted GPA is compared with the average GPA the school reports (3.6 is assumed when a school doesn't report one). Many schools report weighted or school-specific GPAs, so this is a coarse signal on purpose.
- In-state multiplier. Public universities get a 1.25× boost for residents of their state.
- Test-optional. If you won't submit scores, the test multiplier is replaced by a discount that depends on how many of the school's enrolled students submitted SAT scores: no discount where fewer than half did, 0.75× where most did, 0.8× where it's unknown.
The multiplier tables
| Your SAT position in the school's range | Test multiplier | Your GPA minus the school's average | GPA multiplier |
|---|---|---|---|
| Below the 25th percentile by a full range or more | 0.08 | 0.5 or more below | 0.2 |
| Below the 25th percentile (−1 to −0.5) | 0.2 | 0.3 to 0.5 below | 0.4 |
| Just below the 25th percentile (−0.5 to 0) | 0.45 | 0.1 to 0.3 below | 0.7 |
| Lower half of the range (0 to 0.5) | 0.9 | Within 0.1 | 1.0 |
| Upper half of the range (0.5 to 1) | 1.3 | 0.1 or more above | 1.15 |
| Above the 75th percentile (1 to 1.3) | 1.8 | ||
| Well above the 75th percentile (1.3+) | 2.2 |
A school is Likely at 70% or more, Target from 35% to 70% and Reach below 35%. In the template every one of these numbers lives on the Lookups sheet in blue cells, so you can make the model more or less conservative and watch the list change.
How the estimated net price works
Net price is what students actually pay after grants and scholarships, averaged over first-time, full-time undergraduates who received aid, as reported to IPEDS by family income bracket. Pick your bracket and every school shows the figure for that bracket; if a school hasn't reported it, the average for all aid recipients is used instead. For public universities outside your home state, the difference between out-of-state and in-state tuition is added, because the IPEDS figures are based on in-state students.
Your real offer depends on need, merit and each school's aid policy, so treat these as a first filter and run each school's own net price calculator before you decide.
Using the online tool
- Fill in your profile. Everything is optional, but the list only gets sharp once it has a GPA and a test score. Don't know your unweighted GPA? The GPA converter works it out from your transcript.
- Read your list. Reach, Target and Likely each show the best-ranked 15 schools that pass your filters; use Show all to see the rest. The "Using" chips at the top tell you which numbers the list is based on.
- Open a school. Click any name, or pick one from the dropdown in School detail, for your odds, admissions statistics, cost by income bracket, outcomes, student body and four trend charts back to 2010.
- Adjust and compare. Change the budget, switch test-optional on, or add preferred states and the list updates as you type.
What's inside the Excel template
Prefer a spreadsheet? The template does the same calculation with ordinary Excel formulas: no macros, no add-ins, and it opens in Excel Online and Google Sheets.
| Sheet | What it's for | You enter | Calculated for you |
|---|---|---|---|
| Start Here | How to use it, how the estimate works, its limits | Nothing | Nothing |
| My Profile | Your numbers and preferences (yellow cells) | GPA, SAT or ACT, test-optional, home state, income bracket, budget, type, size, kind, up to 3 states, minimum graduation rate | SAT-equivalent used in the match, income bracket number |
| My List | Your results | Nothing | Reach, Target and Likely groups, top 15 each, with chance, admit rate, SAT range, test position, net price, graduation rate, size and rank |
| School Detail | One school in depth | The school (dropdown) | Your odds, admissions, cost and aid, outcomes, student body, 2010–2024 trend table and four charts, links to the website and Common Data Set |
| Schools | All 200 schools: data and every calculation | Nothing (or add a school) | Test position, the three multipliers, estimated chance, category, net price, filter pass, sort keys |
| History | 5,150 school-year rows, 2000–2025 | Nothing | Nothing (feeds the trends) |
| Lookups | Conversion tables and model settings | The blue cells, if you want to tune the model | Nothing |
Step-by-step guide (Excel)
Replace the sample profile
On My Profile, overwrite the yellow cells with your own numbers. Use your unweighted GPA on a 4.0 scale. Enter either an SAT total or an ACT composite; if both are filled in, the SAT is used.
Choose test-optional, state and money
Set Will you submit test scores? to No to apply test-optional. Pick your home state (it drives the in-state boost and the out-of-state tuition add-on) and your family income bracket (it drives the net price). The budget cell is optional: leave it blank to see every school.
Set preferences, or leave them on Any
School type, size and kind of school all default to Any. Fill in up to three preferred states to limit the search, or leave all three blank. A minimum 6-year graduation rate (for example 85) drops schools below it.
Read My List
My List updates on its own. Each group header shows how many schools matched; the table shows the best-ranked 15. The Your test position column tells you at a glance whether your SAT is above, inside or below each school's middle 50%.
Drill into a school
On School Detail, type or choose a school in the yellow cell. Your income bracket is highlighted in the net price table, and the four charts at the bottom plot admit rate, applicants, net price and graduation rate since 2010.
Tune the model if you want
On Lookups, the blue cells hold the category cut-offs, the in-state boost, the assumed GPA and both multiplier tables. Make them more conservative and more schools move to Reach; make them generous and the opposite happens. Nothing else needs to change.
How the formulas work
The template uses only classic functions, so it works in Excel 2016 and Google Sheets. Every calculation happens on the Schools sheet, one column per step, so you can follow it left to right.
=IF(OR(AO2="",AP2="",'My Profile'!$C$25=""),"",('My Profile'!$C$25-AO2)/MAX(AP2-AO2,50))Your SAT-equivalent minus the school's 25th percentile, divided by the width of the middle-50% range (with a 50-point floor so a very narrow range can't blow up the result). 0 is the 25th percentile, 1 is the 75th.
Learn this: How to Write IF Statements in Excel →=IF('My Profile'!$C$8="No",
IF(P2="",Lookups!$N$10,IF(P2<Lookups!$N$11,Lookups!$N$8,Lookups!$N$9)),
IF(AQ2="",1,LOOKUP(AQ2,Lookups!$H$2:$H$8,Lookups!$I$2:$I$8)))If you're test-optional, the multiplier depends on the school's share of SAT submitters. Otherwise LOOKUP does an approximate match: it finds the largest threshold that your position reaches and returns the multiplier next to it. That's the same trick as a tax bracket table.
Learn this: Lookup Formulas in Excel →=MIN(Lookups!$N$6,MAX(Lookups!$N$5,J2*AR2*AS2*AT2))
=IF(AU2>=Lookups!$N$2,"Likely",IF(AU2>=Lookups!$N$3,"Target","Reach"))MIN and MAX clamp the product between the floor and ceiling on the Lookups sheet. A nested IF then turns the number into a category.
Learn this: MIN and MAX Functions in Excel →=IF(AND(AX2=1,AV2="Reach"),A2+ROW()/100000,"")
=IFERROR(MATCH(SMALL(Schools!$AY$2:$AY$201,1),Schools!$AY$2:$AY$201,0),"")Each school that passes your filters gets a sort key in its category's column: its rank plus a tiny row-based tiebreaker. My List then asks SMALL for the 1st, 2nd, 3rd… smallest key, MATCH finds its row, and INDEX pulls the school's details. No sorting, no filters, and it works in any Excel version.
Learn this: How to Use INDEX and MATCH in Excel →Where the data comes from
- Schools. The 200 schools are a composite of the US News, Forbes, Niche, WSJ and CollegeVine rankings, including liberal arts colleges, specialty schools and the service academies. The rank shown is the composite position.
- Admissions, test scores and aid. The latest available year for each school (2019 to 2025), taken from the school's Common Data Set where one is published and from IPEDS (the US Department of Education's NCES database) otherwise. The data year is shown on School Detail and in the Schools sheet.
- Net price by income. IPEDS, average net price for first-time, full-time undergraduates awarded Title IV aid, by family income bracket.
- History. IPEDS and CDS figures for every school from 2000 to 2025: applicants, admits, admit rate, yield, SAT and ACT ranges, net price, graduation rate, retention, tuition and enrollment by race and residency.
- ACT to SAT. The 2018 ACT/College Board concordance table.
Check the key numbers for any school you're serious about on the school's own website: admit rates and test ranges move every year, and this template is a snapshot.
Frequently asked questions
What's the difference between a reach, target and likely school?
A likely (or safety) school is one where your grades and scores are comfortably above most admitted students, so admission is probable. A target (or match) school is one where you look like a typical admitted student. A reach is one where your numbers are below the typical admit, or where the admit rate is so low that nobody can count on getting in. Here the cut-offs are 70% and 35% estimated chance.
How many schools should be on my list?
A common recommendation is 8 to 12 applications: roughly 2–3 likely, 3–5 target and 2–4 reach, with at least one likely school you'd be happy to attend and can afford. Use the budget filter so the likely schools are affordable ones.
Why is a school with a 20% admit rate showing as a target for me?
Because the admit rate is school-wide and your numbers sit above the school's 75th percentile, which multiplies the odds. The estimate only sees numbers; if the school is known for valuing something it can't see, treat the result with care.
Is 1% really the lowest chance?
Yes, the model is capped at 1% and 95%. A 1% reading means "below the model's floor", not a precise probability.
I'm applying test-optional. What changes?
Choose No for submitting scores. Your SAT or ACT is then ignored, and schools where most enrolled students submitted scores get a 0.75× discount; schools that are mostly test-optional get none. Test fit shows "Test-optional" for every school.
Can I add a school that isn't in the top 200?
In the template, yes: add a row on the Schools sheet with the school's admit rate, SAT or ACT range, average GPA, enrollment and net prices (all from its Common Data Set or IPEDS), then copy the formulas in columns AO to BB down to the new row and extend the ranges in My List and School Detail. The online tool uses the fixed list.
Does it work in Google Sheets?
Yes. Upload the .xlsx to Google Drive and open it with Sheets. The dropdowns, LOOKUP, INDEX/MATCH and the charts all carry over.
Learn the skills behind this template
Was this guide helpful? Spot a mistake? Send feedback · admin@arumsoft.com