What you can do with it
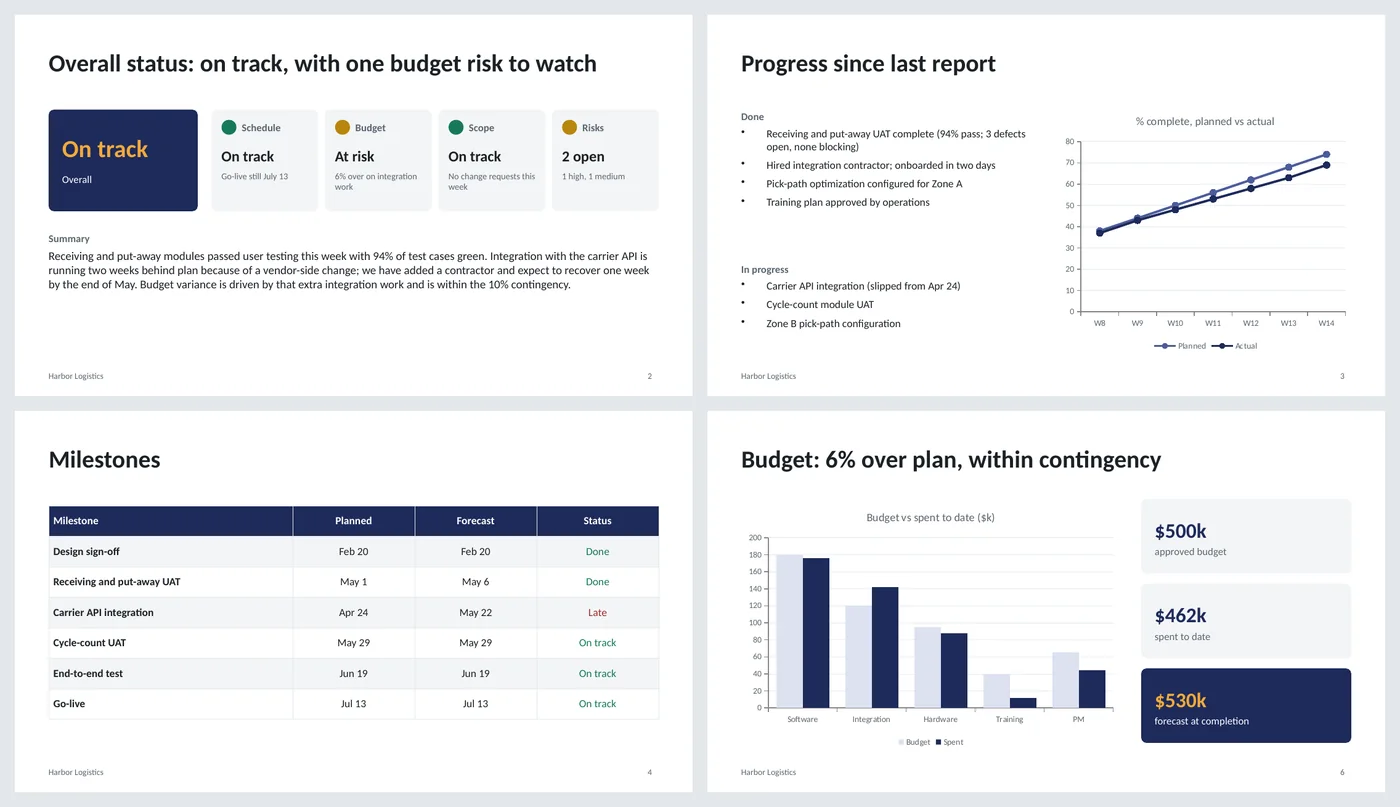
- Status summary with an overall RAG tile, four indicators (schedule, budget, scope, risks) and a three-sentence summary
- Planned vs actual progress chart and a done / in-progress list
- Milestone table with planned, forecast and status; risk register with owner and response
- Budget vs spent chart with approved, spent and forecast tiles; decisions needed as cards
Slide by slide: what to write
Title
Project name, report type and week, date, project manager. Readers skim many of these; make the week number easy to find.
Status summary
An overall RAG word, four indicators with a one-line reason each, and a summary of three sentences: what went well, what is behind and why, what you are doing about it. This is the slide most people stop at.
Progress
What got done since the last report, what is in progress, and a planned-versus-actual chart. Keep "done" to things that are finished, not started.
Milestones
Every milestone with planned date, current forecast and status. A slipped forecast with an honest date beats an "on track" that nobody believes.
Risks and issues
Each with impact, likelihood, owner and response. An issue is a risk that has happened; say so in the likelihood column.
Budget
Budget vs spent by category and three tiles: approved, spent to date, forecast at completion. The title states the variance and whether it is inside contingency.
Next steps and decisions
Dated actions for the next period on the left; on the right, the decisions you need, each with who decides and by when. End the meeting on this slide.
What's in the template
The deck is a finished example, not a blank frame: every slide is filled in for a fictional company so you can see the length, tone and level of detail that works, then overwrite it.
Editing the slide in PowerPoint
Reuse it weekly
Save a copy per week, update the four indicators and the summary first, then the tables. Design › Variants › Colors recolors everything if you want a different scheme.
Update the charts
Right-click a chart › Edit Data. The progress chart has two series (planned, actual); the budget chart has budget and spent per category.
Change the status colors
The green, amber and red words in the tables and the dots on the summary slide use fixed colors so they read the same in any theme. Select the text or dot and change its color to update one.
Add a slide
Duplicate a slide (right-click › Duplicate Slide) rather than inserting a blank one, so the title position and footer match.
How the slide is built
Two layouts (title and content) with placeholders, footer and slide numbers. The summary uses a dark stat tile and four light KPI cards with a colored status dot. Tables are native tables with a dark header row and alternating tint; status words are colored text. Both charts are native PowerPoint charts with a bottom legend and quiet gridlines.
Frequently asked questions
How often should I send a status report?
Weekly for an active project, fortnightly for a slow-moving one. The same deck works for both; only the week number and the "since last report" window change.
What does RAG mean?
Red, amber, green: red is off track and needs a decision, amber is at risk and being managed, green is on track. Define the thresholds once with your sponsor and keep them.
Should I hide bad news?
No. A report that shows a late milestone with a recovery plan builds more trust than one that turns red the week before go-live. The milestone table is where to show it.
Can I use it for a personal or school project?
Yes. Drop the budget slide if there is no money involved and keep the rest.
Is the sample project real?
No. Harbor Logistics and every figure are invented. Replace everything.
Learn the skills behind this template
Was this guide helpful? Spot a mistake? Send feedback · admin@arumsoft.com