What you can do with it
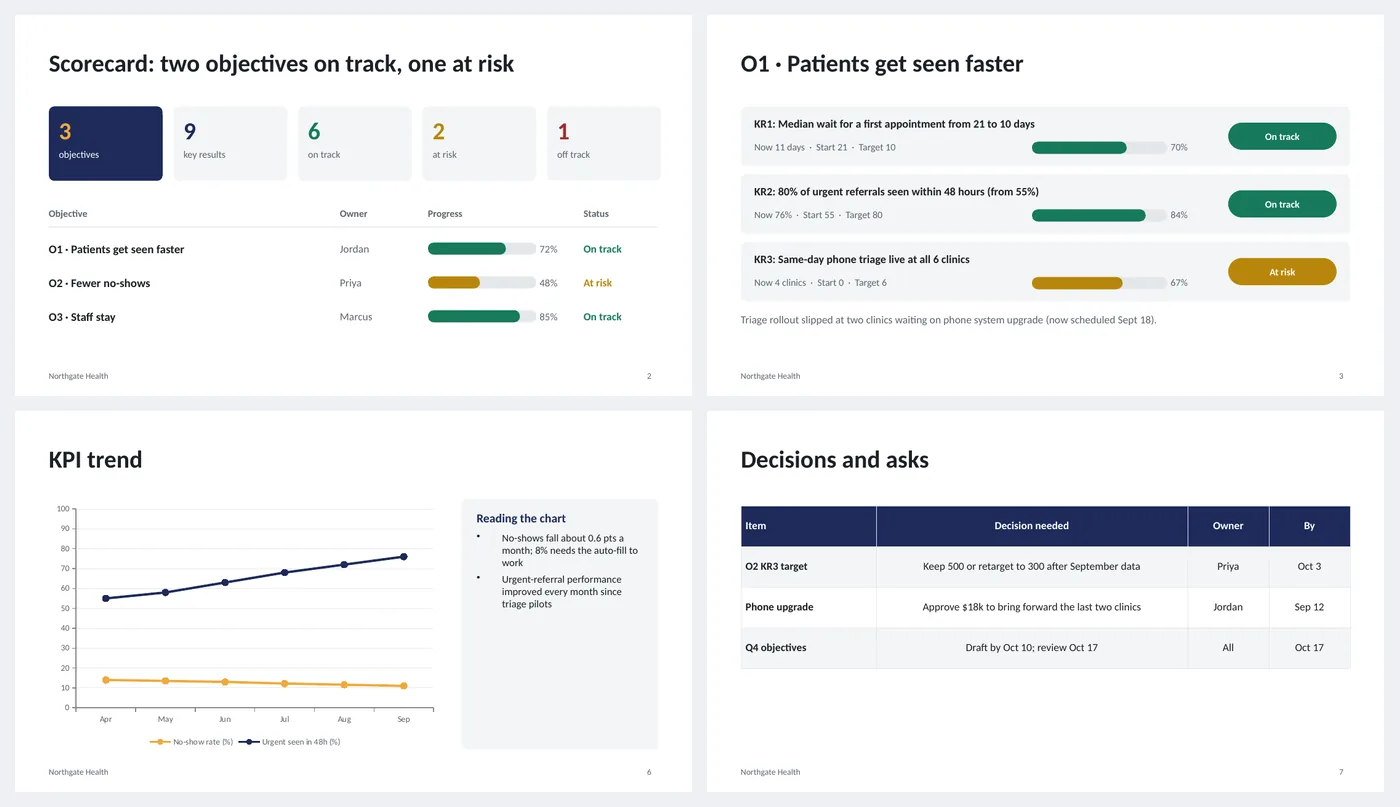
- Scorecard: five status tiles and a progress bar per objective
- Objective slides: key result, now / start / target, progress bar and a colored status pill
- Commentary line under each objective for what changed
- Two-series KPI trend line chart with a reading-the-chart panel
- Decisions table with owner and date
Slide by slide: what to write
Title
Quarter, team, which week of the quarter it is and the owner. The week number tells readers how much time is left.
Scorecard
Count the key results by status, then one bar per objective. The title should say the conclusion: "two on track, one at risk".
Objective slides
One per objective, three key results each. Every key result has a current value, the start value and the target, so progress is a number, not an opinion. Under them, one sentence of what changed and why.
KPI trend
The one or two numbers the objectives depend on, monthly. The panel beside it says what the chart means ("8% needs the auto-fill to work").
Decisions and asks
What needs deciding, by whom, by when. An OKR review that ends without decisions is a status report.
What's in the template
The deck is a finished example, not a blank frame: every slide is filled in for a fictional company so you can see the length, tone and level of detail that works, then overwrite it.
Editing the slide in PowerPoint
Set a progress bar
Each bar is two rounded rectangles: a gray track and a colored fill. Drag the fill's right edge, or set its width in Shape Format › Size as track width × progress.
Change a status
The pill is a rounded rectangle; change its fill to the green, amber or red in the notes and retype the word. The scorecard tiles use the same three colors.
Add a key result
Copy a card (select all four parts) and paste below; three per slide fits, four if you shorten the commentary.
Update the chart
Right-click › Edit Data; each series is a column.
How the slide is built
Three layouts (title, content, dark closing) with placeholders, footer and slide numbers, built on a named theme so Design › Variants recolors every slide at once. Progress bars are pairs of rounded rectangles; status pills are rounded rectangles with white text; the trend is a native line chart with markers; decisions are a PowerPoint table. Green, amber and red are fixed hex colors so status reads the same in any theme.
Frequently asked questions
How is progress calculated?
Progress = (current − start) ÷ (target − start). For a key result that goes down (wait time from 21 to 10 days), the formula is the same; the example rounds to whole percent.
When is a key result "at risk"?
A common rule: on track above 65% progress at week 10 of 13, at risk between 40% and 65%, off track below 40%. Set your own thresholds and write them in the notes.
Can I use it for KPIs without OKRs?
Yes. Keep the scorecard, trend and decisions slides and turn each objective slide into a group of three KPIs with targets.
Should I include every key result?
Yes. Hiding the red ones is the fastest way to lose trust in the review.
Is the sample company real?
No. The company, people and numbers are invented so the deck can show realistic length and tone. Replace all of it.
Learn the skills behind this template
Was this guide helpful? Spot a mistake? Send feedback · admin@arumsoft.com