Warehouse Cycle Count Sheet for Excel
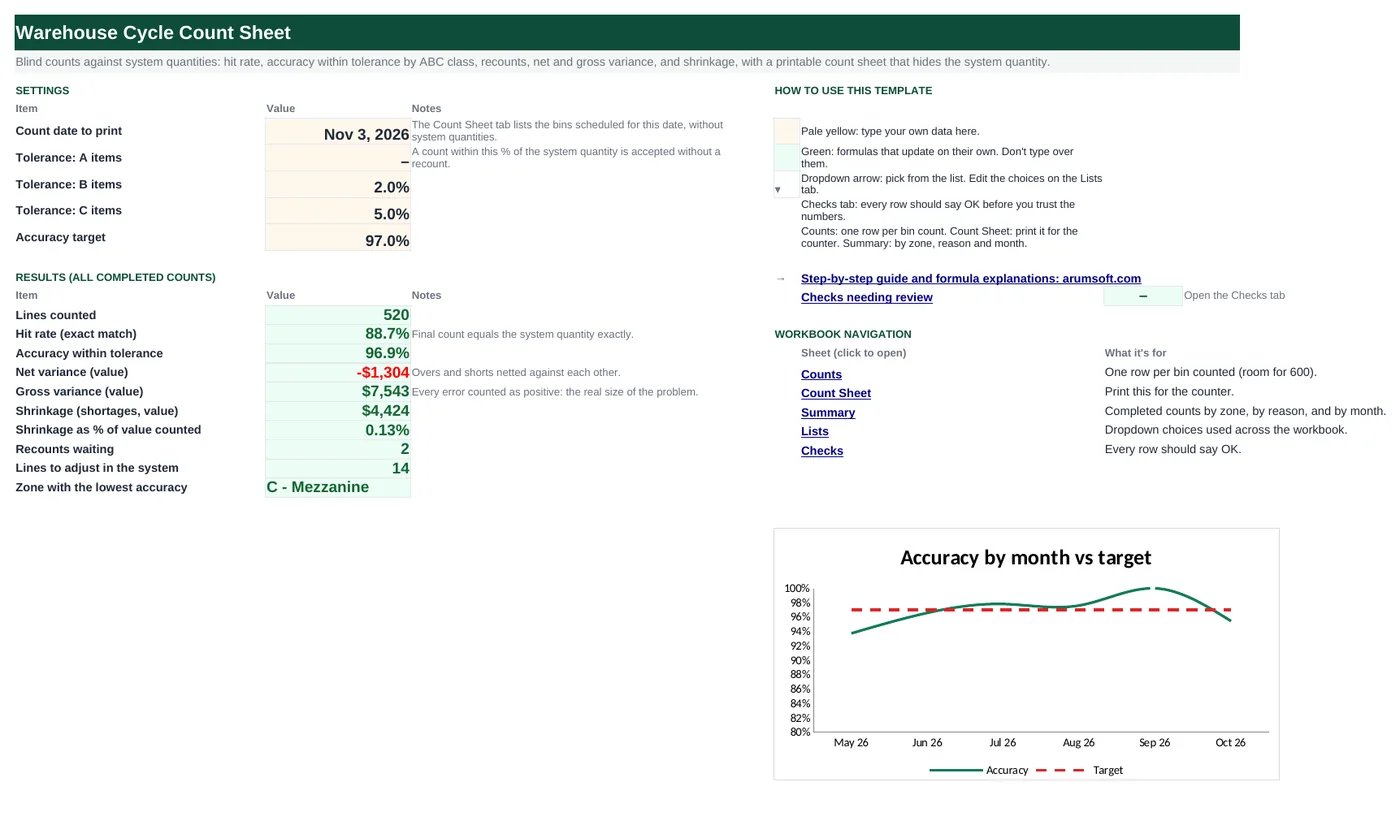
Cycle counting replaces the annual shutdown count with a few bins every day, and it only works if the counts are honest and the follow-up is consistent. This workbook prints a blind count sheet without system quantities, compares each count with the system, accepts small differences within a tolerance set by ABC class, asks for a recount on the rest, and tells you which lines to adjust. It then measures hit rate, accuracy, net and gross variance and shrinkage by zone, by reason and month by month against your target.
- Sheets:
- 6
- Works with:
- Excel for Microsoft 365, Excel 2016 or later, Excel for Mac and Excel for the web
- Updated:
What you can do with it
- Blind count sheet for any date, listing bins and SKUs without the system quantity
- Tolerance by ABC class: Match, Within tolerance, Recount or Adjust for every line
- Hit rate, accuracy, net and gross variance and shrinkage, overall and by zone, reason and month
- Accuracy trend against your target with zones below target highlighted
What's inside
The workbook has 6 sheets. You only type on a few of them; the rest calculate.
| Sheet | What it's for | You enter | Calculated for you |
|---|---|---|---|
| Start Here | Settings and results | Count date to print, tolerance for A, B and C items, accuracy target | Lines counted, hit rate, accuracy, net and gross variance, shrinkage and its %, recounts waiting, lines to adjust, weakest zone |
| Counts | Count log (600) | Date, zone, bin, SKU, description, class, unit cost, system qty, count, recount, counter, reason | Final qty, variance units, $ and %, tolerance, result, month, print line |
| Count Sheet | Printable blind count | Counter name | Bins and SKUs scheduled for the chosen date, without system quantities |
| Summary | By zone, reason and month | Nothing | Lines, hit rate, accuracy, net and gross variance, shrinkage; six-month trend vs target |
| Lists | Dropdowns | Zones, classes, reasons, counters | Nothing |
| Checks | Six data checks | Nothing | OK or Review |
Before you start
- Classify SKUs into A, B and C by value (the ABC Inventory Analysis template does this) and decide how often to count each class.
- Freeze movement in a bin while it is counted, or count before the first pick of the day.
- Agree the reason codes the team will use for adjustments.
Step-by-step guide
Set tolerances and target
Start Here B7–B10: the variance accepted for A, B and C items, and the accuracy you aim for.
Schedule the counts
Counts tab: date, zone, bin, SKU, description, class, unit cost and the system quantity at the time of the count.
Print the blind sheet
Pick the date on Start Here B6 and print the Count Sheet tab. It lists the bins but never the system quantity.
Enter the counts
Column I: what the counter found. The result says Match, Within tolerance or Recount.
Recount and adjust
For Recount lines, count again and enter column J. If it is still off, the line says Adjust: post the adjustment and choose a reason.
Review accuracy
Start Here and the Summary tab show hit rate, accuracy and shrinkage by zone, reason and month.
Formula map
Every formula in the workbook, grouped by the sheet and column it lives in. A column of copied formulas counts once; the range it covers is shown.
| Sheet | Cells | Functions | What it computes | Reads | Feeds |
|---|---|---|---|---|---|
| Counts | K5 copied down to row 604 | IF | Final quantity | I5, J5 | Variance is measured on it. |
| Counts | M5 copied down to row 604 | IF | Variance in dollars | L5, G5 | Net, gross and shrinkage totals all come from this column. |
| Counts | O5 copied down to row 604 | IF, INDEX, MATCH | Tolerance for the line | F5 | Compared with the variance % for the result. |
| Counts | P5 copied down to row 604 | IF, ABS | Result | I5, L5, N5, O5, J5 | Hit rate and accuracy count these results. |
| Counts | T5 copied down to row 604 | IF, COUNTIF | Print line number | A5 | The Count Sheet looks each number up. |
| Count Sheet | B7 copied down to row 66 | IFERROR, INDEX, MATCH | Blind count line | A7 | Printed and handed to the counter. |
| Summary | D5 copied down to row 9 | IF, COUNTIFS | Accuracy by zone | B5 | Red when below the target; the lowest zone is on Start Here. |
| Summary | F5 copied down to row 9 | IF, SUMIFS | Gross variance by zone | — | Shows how big the errors are even when they cancel out. |
| Start Here | B20 | IFERROR, SUMPRODUCT | Shrinkage as % of value counted | — | A rate you can compare month to month and site to site. |
Every formula, explained
Each formula below is copied straight from the file, so what you read here is exactly what the cell contains. Click any cell in Excel to see it in the formula bar.
=IF(I5="", "", IF(J5<>"", J5, I5))The recount if there is one, otherwise the first count.
Piece by piece
I5=""- Not counted yet: blank.
IF(J5<>"", J5, I5)- Recount wins.
With the sample data: I5 = 291, J5 = — → K5 result 291
How it is used: Variance is measured on it.
How to change it: Nothing to change.
Learn this: How to Use the IF Function in Excel →=IF(K5="", "", L5*G5)Units over or short times the unit cost.
Piece by piece
L5- Final − system quantity.
*G5- Unit cost.
With the sample data: L5 = 0, G5 = 15.2 → M5 result 0
How it is used: Net, gross and shrinkage totals all come from this column.
How to change it: Nothing to change.
Learn this: How to Write Basic Formulas in Excel →=IF(F5="", "", INDEX('Start Here'!$B$7:$B$9,
MATCH(F5, {"A", "B", "C"}, 0)))Looks up the tolerance for this SKU's class from Start Here.
Piece by piece
MATCH(F5, {"A","B","C"}, 0)- Position of the class in a fixed list: 1, 2 or 3.
INDEX('Start Here'!$B$7:$B$9, …)- The tolerance in that position.
With the sample data: F5 = B → O5 result 2.0%
How it is used: Compared with the variance % for the result.
How to change it: Change tolerances on Start Here.
Learn this: How to Use INDEX and MATCH in Excel →=IF(A5="", "", IF(I5="", "Pending",
IF(L5=0, "Match", IF(ABS(N5)<=O5, "Within tolerance", IF(J5="", "Recount", "Adjust")))))Pending without a count; Match if exact; Within tolerance if the variance % is inside the tolerance; Recount if not and no recount yet; Adjust if a recount confirms it.
Piece by piece
I5=""- Pending.
L5=0- Match.
ABS(N5)<=O5- Within tolerance.
J5=""- Recount.
"Adjust"- Post the adjustment.
With the sample data: I5 = 291, L5 = 0, N5 = 0, O5 = 2.0%, J5 = — → P5 result Match
How it is used: Hit rate and accuracy count these results.
How to change it: Nothing to change.
Learn this: How to Use the IF Function in Excel →=IF(A5='Start Here'!$B$6,
COUNTIF($A$5:A5, 'Start Here'!$B$6),
"")Numbers the lines scheduled on the chosen date 1, 2, 3… so the Count Sheet can list them in order.
Piece by piece
A5='Start Here'!$B$6- Scheduled for the print date.
COUNTIF($A$5:A5, 'Start Here'!$B$6)- How many such lines so far, counting this one.
With the sample data: A5 = May 4, 2026 → T5 result —
How it is used: The Count Sheet looks each number up.
How to change it: Nothing to change.
Learn this: How to Use COUNTIF and COUNTIFS in Excel →=IFERROR(INDEX(Counts!$B$5:$B$604,
MATCH(A7, Counts!$T$5:$T$604, 0)),
"")Finds the row with print line 1 (2, 3 … below) and returns the zone; the next columns return bin, SKU and description. The system quantity is never pulled.
Piece by piece
MATCH(A7, Counts!$T$5:$T$604, 0)- Row of this line number.
INDEX(Counts!$B$5:$B$604, …)- Zone.
IFERROR(…, "")- Blank past the last line.
With the sample data: A7 = 1 → B7 result A - Fast pick
How it is used: Printed and handed to the counter.
How to change it: Nothing to change.
Learn this: How to Use INDEX and MATCH in Excel →=IF(N(B5)=0, "", (COUNTIFS(Counts!$B$5:$B$604, A5, Counts!$P$5:$P$604, "Match")+COUNTIFS(Counts!$B$5:$B$604, A5, Counts!$P$5:$P$604, "Within tolerance"))/B5)Lines that matched or were within tolerance, divided by lines counted in the zone.
Piece by piece
COUNTIFS(Counts!$B$5:$B$604, A5, Counts!$P$5:$P$604, "Match")- Exact matches.
+COUNTIFS(…, "Within tolerance")- Accepted differences.
/B5- Lines counted.
With the sample data: B5 = 86 → D5 result 1
How it is used: Red when below the target; the lowest zone is on Start Here.
How to change it: Nothing to change.
Learn this: How to Use COUNTIF and COUNTIFS in Excel →=IF(A5="", "", SUMIFS(Counts!$M$5:$M$604,
Counts!$B$5:$B$604, A5, Counts!$M$5:$M$604,
">0")-SUMIFS(Counts!$M$5:$M$604,
Counts!$B$5:$B$604, A5, Counts!$M$5:$M$604,
"<0"))Overages plus shortages without netting: positive variances minus negative ones.
Piece by piece
SUMIFS(…, ">0")- Value of overages.
-SUMIFS(…, "<0")- Value of shortages, made positive.
With the sample data: F5 result 942.29
How it is used: Shows how big the errors are even when they cancel out.
How to change it: Nothing to change.
Learn this: How to Use SUMIF and SUMIFS in Excel →=IFERROR(B19/SUMPRODUCT(N(+Counts!$H$5:$H$604),
N(+Counts!$G$5:$G$604)),
0)Shortage value divided by the system value of everything counted.
Piece by piece
B19- Shrinkage (shortages).
SUMPRODUCT(N(+Counts!$H$5:$H$604), N(+Counts!$G$5:$G$604))- System qty × unit cost for every line; N(+…) turns blanks into 0.
With the sample data: B20 result 0.1%
How it is used: A rate you can compare month to month and site to site.
How to change it: Nothing to change.
Learn this: Essential Excel Functions: SUM, AVERAGE, COUNT, MIN and MAX →Tips and limits
- Capacity: 600 count lines and 60 lines per printed sheet. Start a new file each year or extend the ranges with Ctrl+H.
- Count blind. A counter who can see the system quantity tends to find it.
- Hit rate (exact matches) is the strict measure; accuracy within tolerance is what most warehouses report. Track both.
- Tolerance is a % of the system quantity. For very small bins, a 1-unit difference can exceed 5%; a zero tolerance on A items makes every miss a recount.
- Net variance near zero can hide big errors that cancel; watch gross variance and shrinkage.
Learn the skills behind this template
Was this guide helpful? Spot a mistake? Send feedback · admin@arumsoft.com