Total Compensation Statement Template for Excel
Most employees know their salary and little else. Health premiums the company pays, the 401(k) match, payroll taxes on their wages and insurance usually add a quarter to a half again on top. This workbook works all of that out for every employee from a short list of rates and plan costs, and prints a one-page statement that shows each person what they receive and how it is calculated. It also gives the company the true cost of each role.
- Sheets:
- 6
- Works with:
- Excel for Microsoft 365, Excel 2016 or later, Excel for Mac and Excel for the web
- Updated:
What you can do with it
- Employer medical, dental and vision by plan tier, 401(k) match on a two-tier formula, HSA, life and disability
- Employer Social Security up to the 2026 wage base ($184,500), Medicare, FUTA, SUTA and workers' comp
- Total compensation, benefits as a % of base and paid-time-off value per employee
- A printable one-page statement for the employee you pick, with a chart and plain-language explanations
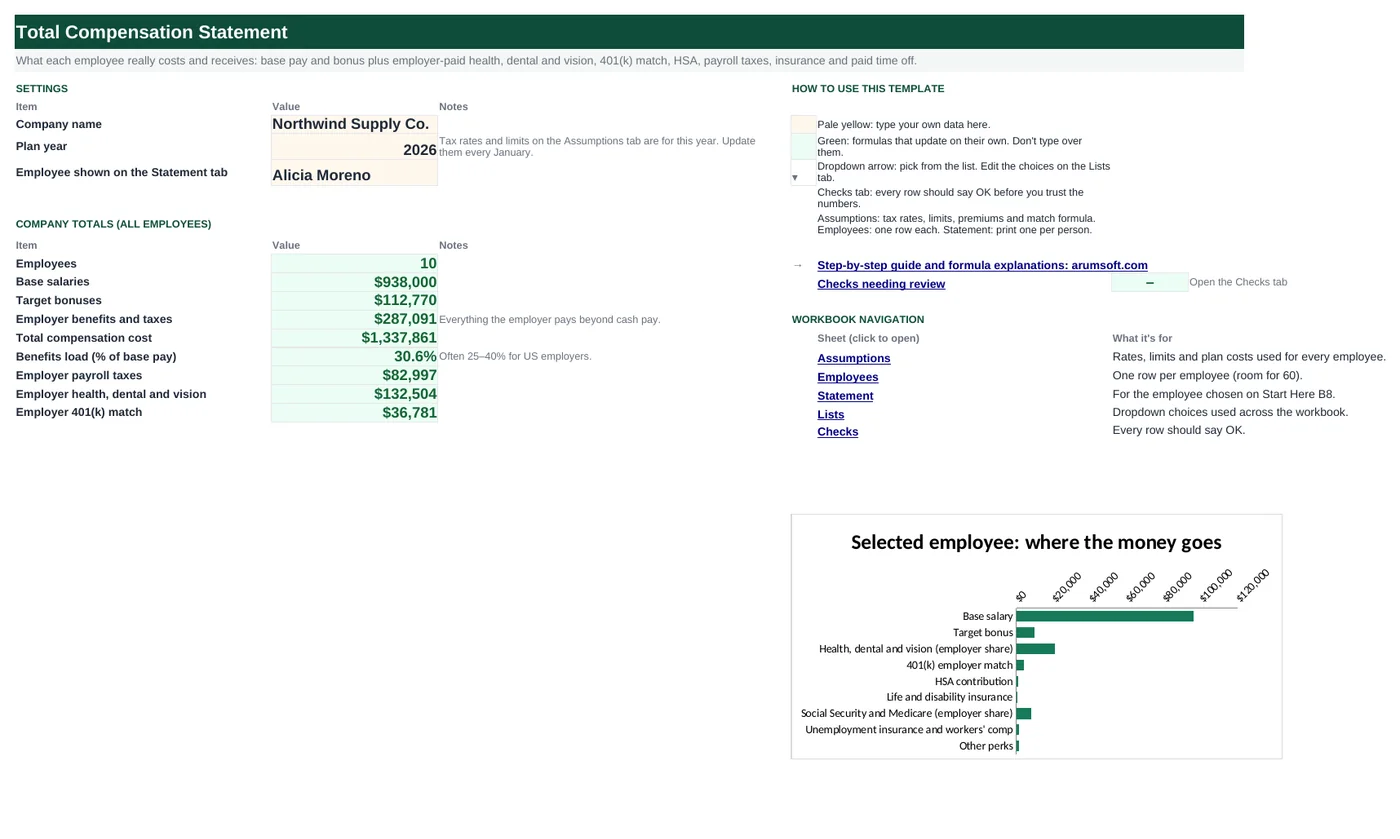
What's inside
The workbook has 6 sheets. You only type on a few of them; the rest calculate.
| Sheet | What it's for | You enter | Calculated for you |
|---|---|---|---|
| Start Here | Settings and company totals | Company name, plan year, employee for the statement | Employees, salaries, bonuses, employer benefits and taxes, total cost, benefits load, payroll taxes, health, 401(k) match |
| Assumptions | Rates, limits and plan costs | Payroll tax rates and wage bases, match formula, plan pay limit, insurance rate, PTO days basis, perks, monthly employer premiums by tier | Nothing |
| Employees | One row per employee (60) | Name, title, department, salary, bonus %, health tier, 401(k) deferral %, HSA, PTO days | Bonus, health cost, 401(k) match, insurance, each payroll tax, PTO value, total benefits and taxes, total compensation, % of base |
| Statement | One-page statement | Nothing (employee chosen on Start Here) | Each component with its share and an explanation, total, PTO value, hidden benefits |
| Lists | Departments | Department names | Nothing |
| Checks | Six data checks | Nothing | OK or Review |
Before you start
- Get the employer share of each health plan's monthly premium by tier from your broker or the renewal.
- Get your state unemployment rate and wage base (your state notice) and your workers' comp rate per $100 of payroll (your policy).
- Pull each employee's 401(k) deferral % and health elections from payroll.
Step-by-step guide
Check the assumptions
Assumptions tab: 2026 federal rates are filled in; replace the SUTA rate and wage base, workers' comp rate, match formula and premiums with yours.
List employees
Employees tab: name, title, department, base salary, target bonus %, health tier, deferral %, employer HSA deposit and PTO days.
Review the totals
Start Here: total cost and benefits load for the company.
Pick an employee
Start Here B8: choose a name.
Print the statement
Statement tab: one page with each component, its share of the total and how it was calculated.
Update every January
Change the plan year, the wage base and limits on the Assumptions tab, and the new premiums.
Formula map
Every formula in the workbook, grouped by the sheet and column it lives in. A column of copied formulas counts once; the range it covers is shown.
| Sheet | Cells | Functions | What it computes | Reads | Feeds |
|---|---|---|---|---|---|
| Employees | K5 copied down to row 64 | IF, SUMPRODUCT | Employer health, dental and vision | F5 | The biggest hidden benefit for most people. |
| Employees | M5 copied down to row 64 | IF, MIN, MAX | 401(k) employer match | L5, G5 | Someone deferring 6% gets the full 4% match; someone deferring 0% gets nothing. |
| Employees | O5 copied down to row 64 | IF, MIN | Employer Social Security | D5, J5 | Medicare (P5) is 1.45% with no cap; FUTA and SUTA (Q5, R5) use the same MIN pattern with their own wage bases. |
| Employees | S5 copied down to row 64 | IF | Workers' compensation | D5, J5 | Part of employer taxes and insurance on the statement. |
| Employees | T5 copied down to row 64 | IF | Paid time off value | D5, I5 | Shown on the statement but not added to total cost, because it is already inside the salary. |
| Employees | V5 copied down to row 64 | IF | Employer benefits and taxes | K5, M5, O5 | Total compensation = salary + bonus + this; % of base = this ÷ salary. |
| Statement | B10 | IFERROR, INDEX | Statement line | — | Each statement line reads a different column the same way. |
| Statement | B20 | arithmetic | Hidden benefits | B17, B8, B9 | The headline number on the statement. |
Every formula, explained
Each formula below is copied straight from the file, so what you read here is exactly what the cell contains. Click any cell in Excel to see it in the formula bar.
=IF(A5="", "", 12*SUMPRODUCT((Assumptions!$A$24:$A$28=F5)*(Assumptions!$B$24:$B$28+Assumptions!$C$24:$C$28+Assumptions!$D$24:$D$28)))Finds the employee's tier in the premium table and adds the employer's monthly medical, dental and vision amounts, times 12.
Piece by piece
(Assumptions!$A$24:$A$28=F5)- 1 on the row of this employee's tier.
*(Assumptions!$B$24:$B$28+…$C…+…$D…)- Medical + dental + vision on each row.
SUMPRODUCT(…)- Returns the tier's monthly total.
12*…- Annual.
With the sample data: F5 = Family → K5 result 21,084
How it is used: The biggest hidden benefit for most people.
How to change it: Edit premiums on the Assumptions tab.
Learn this: Essential Excel Functions: SUM, AVERAGE, COUNT, MIN and MAX →=IF(A5="", "", L5*(Assumptions!$B$13*MIN(G5, Assumptions!$B$14)+Assumptions!$B$15*MAX(0, MIN(G5, Assumptions!$B$16)-Assumptions!$B$14)))Two-tier match: 100% of deferrals up to 3% of pay, then 50% of deferrals between 3% and 5%, on pay up to the plan limit.
Piece by piece
L5- Plan pay: salary + bonus, capped at the 2026 limit of $360,000.
Assumptions!$B$13*MIN(G5, Assumptions!$B$14)- First tier: 100% × deferral up to 3%.
Assumptions!$B$15*MAX(0, MIN(G5, Assumptions!$B$16)-Assumptions!$B$14)- Second tier: 50% × the part of the deferral between 3% and 5%.
L5*(…)- Times plan pay.
With the sample data: L5 = 105,600, G5 = 6.0% → M5 result 4,224
How it is used: Someone deferring 6% gets the full 4% match; someone deferring 0% gets nothing.
How to change it: Change the tiers on the Assumptions tab (a single tier: set the second match to 0).
Learn this: How to Use MIN and MAX in Excel →=IF(A5="", "", Assumptions!$B$5*MIN(D5+J5, Assumptions!$B$6))6.2% of wages up to the Social Security wage base.
Piece by piece
MIN(D5+J5, Assumptions!$B$6)- Wages, capped at $184,500 for 2026.
Assumptions!$B$5*…- × 6.2%.
With the sample data: D5 = 96,000, J5 = 9,600 → O5 result 6,547.2
How it is used: Medicare (P5) is 1.45% with no cap; FUTA and SUTA (Q5, R5) use the same MIN pattern with their own wage bases.
How to change it: Update the wage base each January.
Learn this: How to Use MIN and MAX in Excel →=IF(A5="", "", (D5+J5)/100*Assumptions!$B$12)Premiums are quoted per $100 of payroll.
Piece by piece
(D5+J5)/100- Hundreds of dollars of pay.
*Assumptions!$B$12- Rate per $100.
With the sample data: D5 = 96,000, J5 = 9,600 → S5 result 897.6
How it is used: Part of employer taxes and insurance on the statement.
How to change it: Use your policy rate; for several class codes, put a rate per department in a lookup.
Learn this: How to Write Basic Formulas in Excel →=IF(A5="", "", D5/Assumptions!$B$19*I5)Daily rate (salary ÷ working days) × PTO days.
Piece by piece
D5/Assumptions!$B$19- Daily rate.
*I5- PTO days.
With the sample data: D5 = 96,000, I5 = 22 → T5 result 8,123.08
How it is used: Shown on the statement but not added to total cost, because it is already inside the salary.
How to change it: Nothing to change.
Learn this: How to Write Basic Formulas in Excel →=IF(A5="", "", K5+H5+M5+N5+O5+P5+Q5+R5+S5+U5)Everything the employer pays beyond salary and bonus.
Piece by piece
K5+H5+M5+N5- Health, HSA, 401(k) match, life and disability.
+O5+P5+Q5+R5+S5- Social Security, Medicare, FUTA, SUTA, workers' comp.
+U5- Other perks.
With the sample data: K5 = 21,084, M5 = 4,224, O5 = 6,547.2 → V5 result 37,777
How it is used: Total compensation = salary + bonus + this; % of base = this ÷ salary.
How to change it: Nothing to change.
Learn this: How to Use the SUM Function in Excel →=IFERROR(INDEX(Employees!$K$5:$K$64, $F$4), 0)Pulls the employee's health cost from the Employees tab using the row found for the chosen name.
Piece by piece
$F$4 = MATCH(B4, Employees!$A$5:$A$64, 0)- The chosen employee's row.
INDEX(Employees!$K$5:$K$64, $F$4)- Their value in this column.
IFERROR(…, 0)- Zero if the name is not found.
With the sample data: B10 result 21,084
How it is used: Each statement line reads a different column the same way.
How to change it: Choose the employee on Start Here B8.
Learn this: How to Use INDEX and MATCH in Excel →=B17-B8-B9Total compensation minus the cash pay (salary and bonus).
Piece by piece
B17- Total compensation.
-B8-B9- Less base salary and target bonus.
With the sample data: B17 = 143,377, B8 = 96,000, B9 = 9,600 → B20 result 37,777
How it is used: The headline number on the statement.
How to change it: Nothing to change.
Learn this: How to Write Basic Formulas in Excel →Tips and limits
- Federal figures are for 2026: Social Security 6.2% to $184,500, Medicare 1.45%, FUTA 0.6% on the first $7,000 (if you get the full state credit), 401(a)(17) pay limit $360,000. Update them every January.
- State unemployment and workers' comp rates on the Assumptions tab are examples only; use your own notices.
- The bonus is the target. For a year-end statement, replace target bonus % with the actual bonus paid.
- The extra 0.9% Medicare on pay over $200,000 is withheld from the employee only, so it is not an employer cost here.
- This is an information statement, not a payroll record; plan documents and pay records govern.
Learn the skills behind this template
Was this guide helpful? Spot a mistake? Send feedback · admin@arumsoft.com