What you can do with it
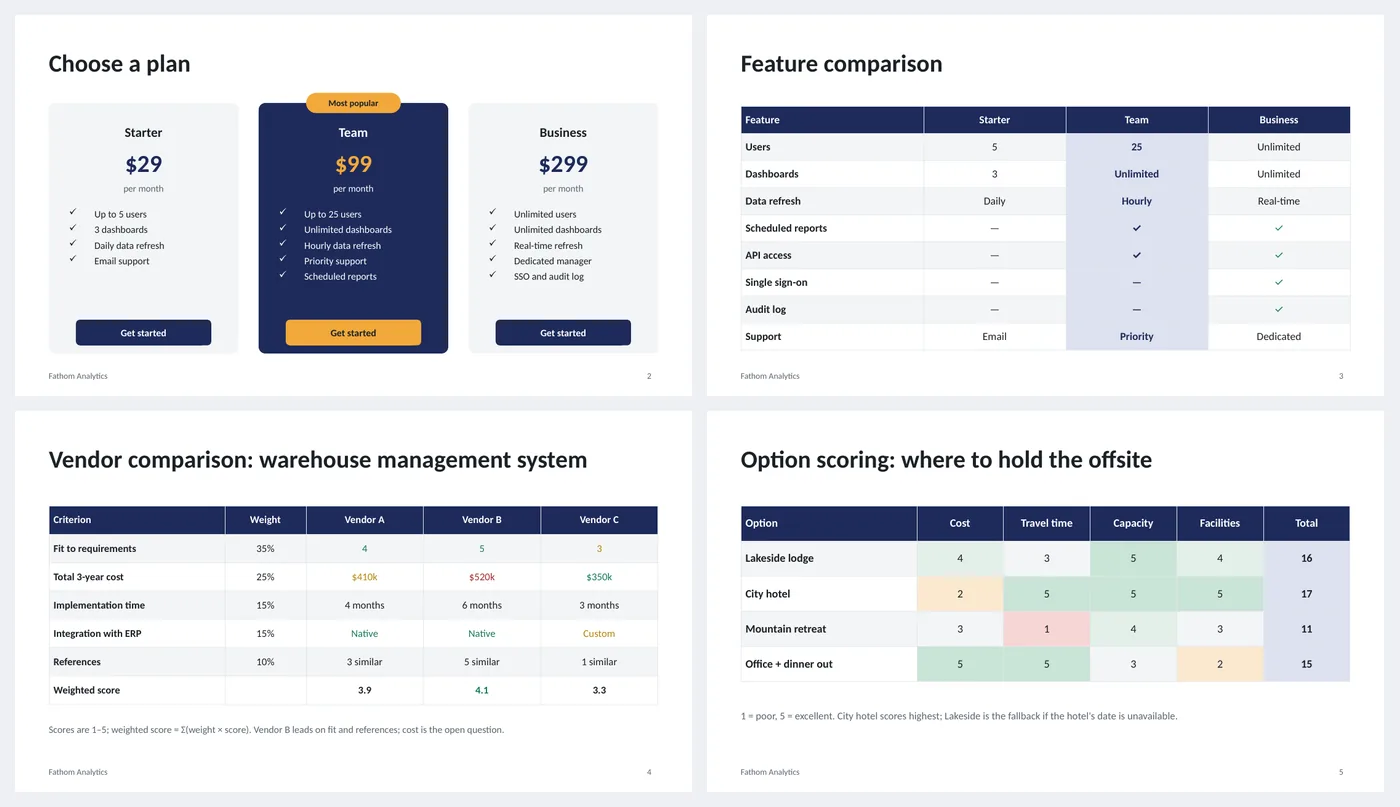
- Three pricing cards with price, period, checkmark features and a button; one highlighted
- Feature comparison table with ✓ and — and a shaded recommended column
- Weighted vendor table: criteria, weights, colored values and a weighted-score row
- Option scoring table with 1–5 heat-map cells and totals
- Native PowerPoint tables: add rows and columns normally
Slide by slide: what to write
Title
What is being compared and for which decision.
Pricing cards
Three plans; the middle one highlighted with a badge. Four or five features each, the differences first. A button label even on a slide, because readers expect it.
Feature table
Rows are features, columns are plans, cells are ✓, — or a short value. Shade the column you recommend so the eye lands there.
Vendor comparison
Criteria with weights that add to 100%, one column per vendor, values colored green, amber or red, and a weighted-score row at the bottom. The note under the table states the formula.
Option scoring
Options as rows, criteria as columns, scores 1 to 5 with a heat-map fill, totals on the right. The note says what the scale means and which option wins.
What's in the template
The deck is a finished example, not a blank frame: every slide is filled in for a fictional company so you can see the length, tone and level of detail that works, then overwrite it.
Editing the slide in PowerPoint
Add a plan or vendor column
Click in a column, Table Layout › Insert Right. Then select the whole table and Table Layout › Distribute Columns.
Change which column is highlighted
Select the shaded column cells, Table Design › Shading › pick the light accent color; set the old column back to No Fill.
Recolor a heat-map cell
Select the cell, Table Design › Shading. The five fills from poor to excellent are listed in the notes of slide 5.
Change the colors
Design › Variants › Colors. Every shape, table and chart uses theme colors, so one change recolors the whole deck. The green, amber and red status words are fixed on purpose.
How the slide is built
Three layouts (title, content, dark closing) with placeholders, footer and slide numbers, built on a named theme so Design › Variants recolors every slide at once. Pricing cards are rounded rectangles with a badge pill and a button shape; the three tables are PowerPoint tables with per-cell fills, so sorting or pasting into Excel keeps the values.
Frequently asked questions
Can I make the pricing cards a table instead?
Yes; slide 3 is that table. Cards are for a marketing or sales context, the table for an internal decision.
How do I compute the weighted score?
For each vendor, multiply each criterion score by its weight and add them up. Put the arithmetic in Excel and paste the result; the slide shows the answer, not the formula.
Why color the cells instead of using icons?
Colored fills survive copy-paste, print in grayscale as light and dark, and do not need an icon font. Checkmarks are plain text (✓).
Can I use the scoring table for hiring or site selection?
Yes. Any decision with options and criteria fits; keep criteria to five or six and agree on the weights before scoring.
Are the companies and prices real?
No. Everything is invented. Replace it all.
Learn the skills behind this template
Was this guide helpful? Spot a mistake? Send feedback · admin@arumsoft.com