Solar Panel ROI and Payback Calculator for Excel
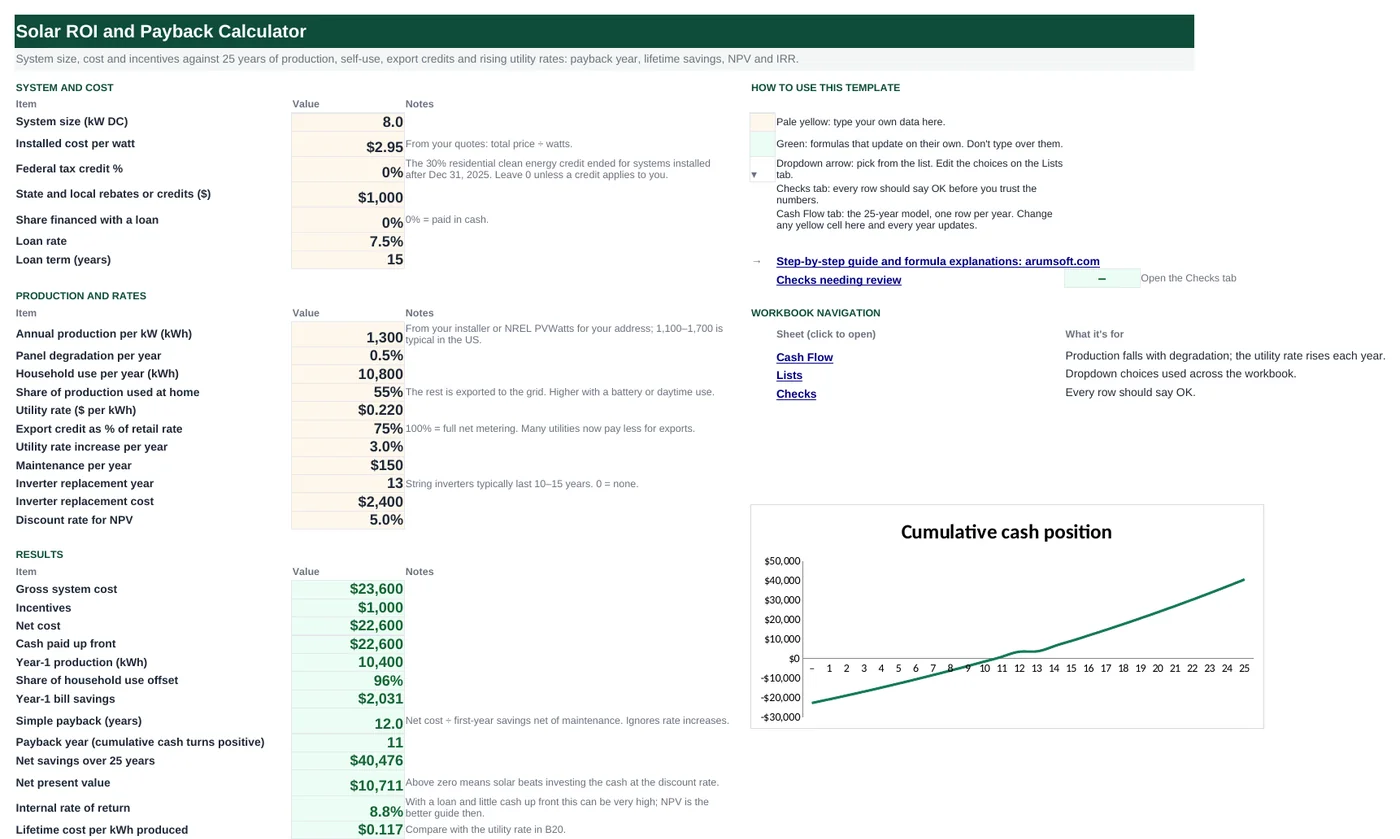
Solar pays back through the electricity you no longer buy, and that depends on how much the panels produce, how much of it you use yourself, what the utility pays for the rest, and how fast rates rise. This workbook models 25 years of all of it, with degradation, an inverter replacement and an optional loan, and gives the payback year, net savings, NPV, IRR and your lifetime cost per kWh to compare with the utility rate.
- Sheets:
- 4
- Works with:
- Excel for Microsoft 365, Excel 2016 or later, Excel for Mac and Excel for the web
- Updated:
What you can do with it
- Gross cost, incentives, net cost and cash up front, with an optional loan
- 25-year production with degradation, split into self-used and exported kWh
- Savings at a rising retail rate and a separate export credit
- Payback year, net 25-year savings, NPV, IRR and lifetime cost per kWh
What's inside
The workbook has 4 sheets. You only type on a few of them; the rest calculate.
| Sheet | What it's for | You enter | Calculated for you |
|---|---|---|---|
| Start Here | System, rates and results | Size, cost per watt, federal credit %, rebates, loan share, rate and term, production per kW, degradation, household use, self-use share, utility rate, export credit %, rate increase, maintenance, inverter year and cost, discount rate | Gross cost, incentives, net cost, cash up front, year-1 production and offset, year-1 savings, simple payback, payback year, 25-year savings, NPV, IRR, lifetime cost per kWh |
| Cash Flow | 25 years | Nothing | Production, self-used, exported, retail and export rates, savings, maintenance, inverter, loan payment, net cash flow, cumulative |
| Lists | Reference | Nothing | Nothing |
| Checks | Six checks | Nothing | OK or Review |
Before you start
- Get at least two installer quotes and divide each total by the system watts for cost per watt.
- Get expected production for your roof from the installer or NREL's free PVWatts calculator (kWh per kW per year).
- Read your utility's net metering or export tariff: whether exports earn the full retail rate or less.
Step-by-step guide
Enter the system and cost
Start Here B6–B12: size in kW, cost per watt, any tax credit %, rebates, and the share financed with its rate and term.
Enter production and use
B16–B19: annual production per kW, degradation, household use per year and the share of production you use at home (the rest is exported).
Enter rates
B20–B26: utility rate, export credit as a share of retail, annual rate increase, maintenance, inverter replacement year and cost, and the discount rate for NPV.
Read the Cash Flow tab
Each year: production, self-used and exported kWh, retail and export rates, bill savings, maintenance, inverter, loan payment, net cash flow and the cumulative position. Year 0 is the cash paid up front.
Read the results
B30–B42: net cost, offset, year-1 savings, simple payback, the year the cumulative position turns positive, 25-year net savings, NPV, IRR and lifetime cost per kWh.
Test the assumptions
Change the export credit, rate increase or self-use share one at a time and watch the payback year; those three move the answer most.
Formula map
Every formula in the workbook, grouped by the sheet and column it lives in. A column of copied formulas counts once; the range it covers is shown.
| Sheet | Cells | Functions | What it computes | Reads | Feeds |
|---|---|---|---|---|---|
| Cash Flow | B6 copied down to row 30 | arithmetic | Production in a year | A6 | Split into self-used and exported kWh. |
| Cash Flow | C6 copied down to row 30 | MIN | Used at home | B6 | Saved at the full retail rate; the rest is exported. |
| Cash Flow | E6 copied down to row 30 | arithmetic | Retail rate in a year | A6 | Export rate = this × export credit %. |
| Cash Flow | G6 copied down to row 30 | arithmetic | Bill savings | C6, E6, D6, F6 | The income side of the net cash flow. |
| Cash Flow | J6 copied down to row 30 | IF, OR, PMT | Loan payment | A6 | Subtracted from savings in the net cash flow. |
| Cash Flow | L6 copied down to row 30 | arithmetic | Cumulative position | L5, K6 | The payback year is the first year it turns positive; charted on Start Here. |
| Start Here | B37 | IF | Simple payback | B32, B36, B23 | Compare with the payback year in B38, which accounts for both. |
| Start Here | B38 | IFERROR, INDEX, MATCH, TRUE | Payback year | — | The headline number. |
| Start Here | B40 | NPV | Net present value | B26 | Above zero: solar beats investing the same cash at the discount rate. |
| Start Here | B41 | IFERROR, IRR | Internal rate of return | — | An annual return to compare with other uses of the money. |
Every formula, explained
Each formula below is copied straight from the file, so what you read here is exactly what the cell contains. Click any cell in Excel to see it in the formula bar.
='Start Here'!$B$6*'Start Here'!$B$16*(1-'Start Here'!$B$17)^(A6-1)System size times production per kW, reduced by degradation for every year after the first.
Piece by piece
'Start Here'!$B$6*'Start Here'!$B$16- Year-1 production.
(1-'Start Here'!$B$17)^(A6-1)- Degradation compounded.
With the sample data: A6 = 1 → B6 result 10,400
How it is used: Split into self-used and exported kWh.
How to change it: Nothing to change.
Learn this: How to Write Basic Formulas in Excel →=MIN(B6*'Start Here'!$B$19, 'Start Here'!$B$18)The self-use share of production, but never more than the household uses in a year.
Piece by piece
B6*'Start Here'!$B$19- Self-use share of production.
'Start Here'!$B$18- Household use.
MIN(…, …)- The smaller of the two.
With the sample data: B6 = 10,400 → C6 result 5,720
How it is used: Saved at the full retail rate; the rest is exported.
How to change it: Nothing to change.
Learn this: How to Use MIN and MAX in Excel →='Start Here'!$B$20*(1+'Start Here'!$B$22)^(A6-1)Today's rate grown by the annual increase.
Piece by piece
'Start Here'!$B$20- Rate today.
(1+'Start Here'!$B$22)^(A6-1)- Compounded increase.
With the sample data: A6 = 1 → E6 result 22.0%
How it is used: Export rate = this × export credit %.
How to change it: Nothing to change.
Learn this: How to Write Basic Formulas in Excel →=C6*E6+D6*F6Self-used kWh at the retail rate plus exported kWh at the export rate.
Piece by piece
C6*E6- Self-use savings.
+D6*F6- Export credits.
With the sample data: C6 = 5,720, E6 = 22.0%, D6 = 4,680, F6 = 16.5% → G6 result 2,030.6
How it is used: The income side of the net cash flow.
How to change it: Nothing to change.
Learn this: How to Write Basic Formulas in Excel →=IF(OR('Start Here'!$B$10=0,
A6>'Start Here'!$B$12), 0,
-PMT('Start Here'!$B$11,
'Start Here'!$B$12, 'Start Here'!$B$32*'Start Here'!$B$10))Annual payment on the financed share for the loan term; zero when paid in cash or after the term.
Piece by piece
'Start Here'!$B$10=0- Cash purchase.
A6>'Start Here'!$B$12- Loan paid off.
-PMT(rate, term, net cost × share financed)- Annual payment, made positive.
With the sample data: A6 = 1 → J6 result 0
How it is used: Subtracted from savings in the net cash flow.
How to change it: For a monthly loan, use rate/12 and term×12 and multiply by 12.
Learn this: Essential Excel Functions: SUM, AVERAGE, COUNT, MIN and MAX →=L5+K6Last year's cumulative plus this year's net cash flow, starting from the negative up-front cost in year 0.
Piece by piece
L5- Cumulative to last year.
+K6- This year's net cash flow.
With the sample data: L5 = -22,600, K6 = 1,880.6 → L6 result -20,719.4
How it is used: The payback year is the first year it turns positive; charted on Start Here.
How to change it: Nothing to change.
Learn this: How to Write Basic Formulas in Excel →=IF(B36-B23=0, "", B32/(B36-B23))Net cost divided by first-year savings net of maintenance. Quick, but it ignores rate increases and degradation.
Piece by piece
B32- Net cost.
/(B36-B23)- Year-1 savings minus maintenance.
With the sample data: B32 = 22,600, B36 = 2,030.6, B23 = 150 → B37 result 12.02
How it is used: Compare with the payback year in B38, which accounts for both.
How to change it: Nothing to change.
Learn this: How to Write Basic Formulas in Excel →=IFERROR(INDEX('Cash Flow'!$A$6:$A$30,
MATCH(TRUE(), INDEX('Cash Flow'!$L$6:$L$30>=0, 0), 0)),
"Not within 25 years")The first year in which the cumulative cash position is zero or more. INDEX(…>=0, 0) turns the comparison into an array MATCH can search for TRUE.
Piece by piece
'Cash Flow'!$L$6:$L$30>=0- TRUE from the payback year on.
INDEX(…, 0)- Makes it an array without Ctrl+Shift+Enter.
MATCH(TRUE, …, 0)- Position of the first TRUE.
INDEX('Cash Flow'!$A$6:$A$30, …)- The year number.
IFERROR(…, "Not within 25 years")- If it never turns positive.
With the sample data: B38 result 11
How it is used: The headline number.
How to change it: Nothing to change.
Learn this: How to Use INDEX and MATCH in Excel →=NPV(B26, 'Cash Flow'!$K$6:$K$30)+'Cash Flow'!$K$5Present value of years 1–25 at the discount rate, plus the year-0 outlay (already negative).
Piece by piece
NPV(B26, 'Cash Flow'!$K$6:$K$30)- Discounted net cash flows.
+'Cash Flow'!$K$5- Up-front cash (year 0, not discounted).
With the sample data: B26 = 5.0% → B40 result 10,711.26
How it is used: Above zero: solar beats investing the same cash at the discount rate.
How to change it: Change the discount rate in B26.
Learn this: Essential Excel Functions: SUM, AVERAGE, COUNT, MIN and MAX →=IFERROR(IRR('Cash Flow'!$K$5:$K$30), "")The rate at which the 26 cash flows (year 0 to 25) have a net present value of zero.
Piece by piece
IRR('Cash Flow'!$K$5:$K$30)- IRR of the full stream.
IFERROR(…, "")- Blank if it cannot be found.
With the sample data: B41 result 8.8%
How it is used: An annual return to compare with other uses of the money.
How to change it: Nothing to change.
Learn this: Essential Excel Functions: SUM, AVERAGE, COUNT, MIN and MAX →Tips and limits
- The 30% federal residential clean energy credit ended for systems installed after December 31, 2025, so the sample uses 0%. Put any state or local credit in B9.
- The export credit is the assumption that moves the result most. Many utilities have moved from full net metering to paying a wholesale or "avoided cost" rate for exports; check your tariff.
- Raising self-use (running appliances during the day, a heat pump water heater, a battery) improves payback when exports earn less than retail.
- Utility rate increases compound. 3% is a reasonable long-run figure, but try 2% and 5% to see the range.
- With a loan and little cash up front, IRR can be very large or undefined; NPV and the cumulative chart are the better guides.
Learn the skills behind this template
Was this guide helpful? Spot a mistake? Send feedback · admin@arumsoft.com